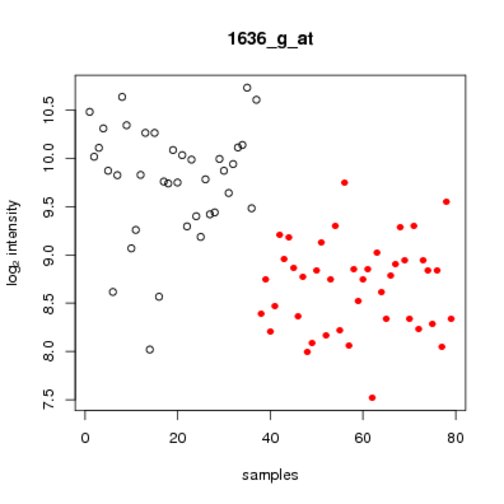
Figure 6.3:
The ALLsfilt data for the top differentially expressed probe set across the 79 samples. The value of the protect mol.biol variable is indicated by the plot symbols.