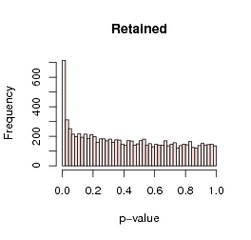
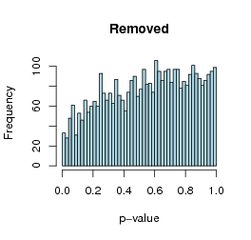
Figure 6.2:
Histograms of p-values. The left panel shows those p-values retained after nonspecific filering; the right panel shows those that were removed.